Pulling Cisco Configs with Netmiko Automation Library
Table of Contents
Overview
I wanted to get some hands-on experience with network automation before diving into tools like Ansible and Terraform for my capstone project, LoNSeMonSy. Instead of jumping straight into playbooks, I figured it’d be worth understanding what’s actually happening at the SSH level first. This project uses Python and Netmiko to connect to my Cisco switch and pull basic interface status data.
Setup
I started by verifying the version of Python installed on my Windows 11 machine. The terminal showed Python 3.13.12, which is the current release. That confirmed my environment was ready.
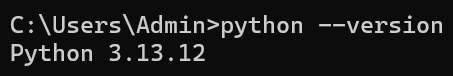 Verifying Python 3.13 is installed.
Netmiko is a Python library that simplifies SSH connections to network devices. According to its author, the purposes of this library are the following:
- Successfully establish an SSH connection to the device.
- Simplify the execution, retrieval, and formatting of show commands.
- Simplify the execution of configuration commands.
- Abstract away much of the low-level mechanics of interacting with devices.
- Provide a (relatively) uniform API for interacting with devices.
- Do the above across a broad set of networking vendors and platforms.
Source: Netmiko Python Library by Kirk Byers
I installed it using:
pip install netmiko
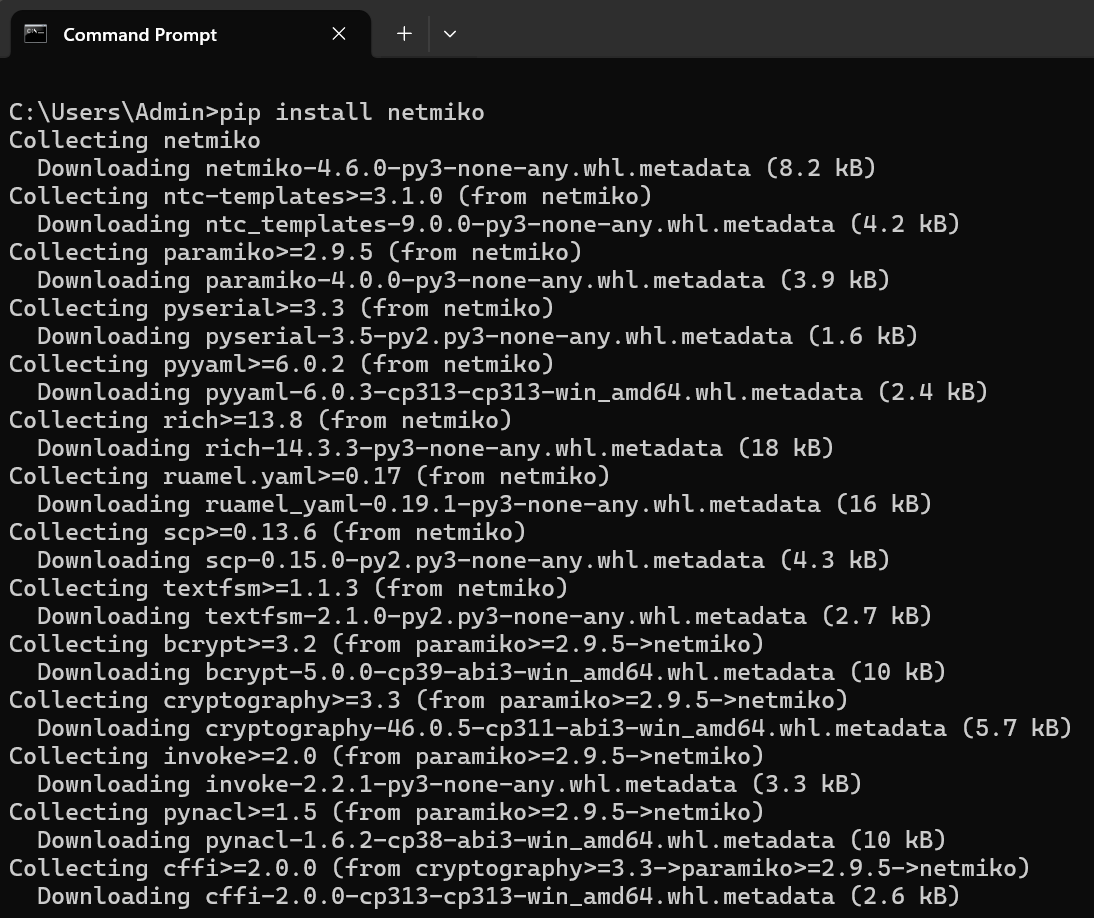 Installing Netmiko via pip.
To allow the script to connect to my Cisco WS-C3560CX-12TC-S switch, I created a management VLAN. I used VLAN 999 and configured an SVI with the IP address 192.168.12.99 255.255.255.0. This IP serves as the management interface that Python connects to over SSH.
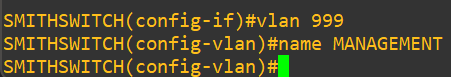 Creating VLAN 999 on the switch.
 Configuring the SVI with IP 192.168.12.99.
I then assigned the port connected to my computer, G0/1, to VLAN 999 as an access port. No trunking was required since this setup only needed a single VLAN for management.
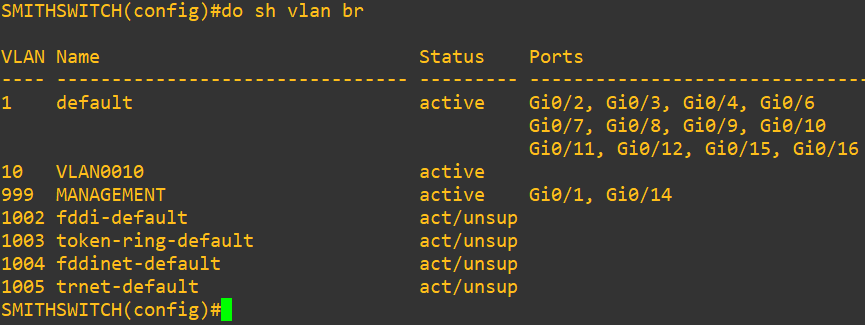 VLAN table showing G0/1 and G0/14 assigned to VLAN 999.
In this lab, both G0/1 (my PC) and G0/14 (my T-Mobile router) are configured as access ports in VLAN 999. My home router does not support VLAN tagging, so it must connect as a normal access device. In enterprise networks, routers or firewalls usually connect using trunk or routed interfaces instead.
SSH was already configured on the switch, so I moved on to verifying connectivity by pinging 192.168.12.99 from my PC. Once I received replies, I confirmed that Layer 2 and Layer 3 connectivity were working properly.
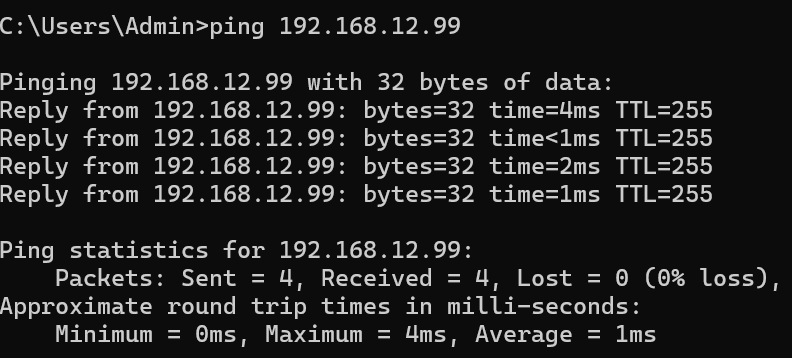 Pinging the management IP to confirm connectivity.
With Python installed, Netmiko configured, and management access verified, the environment was ready for scripting.
The Script
The script does four things:
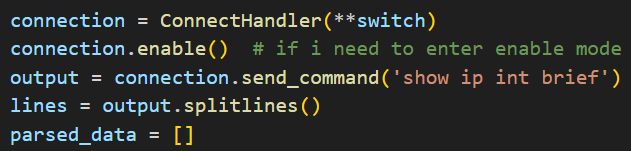
- Connects to the switch using the management IP, username, and password defined at the top of the script.
- Sends
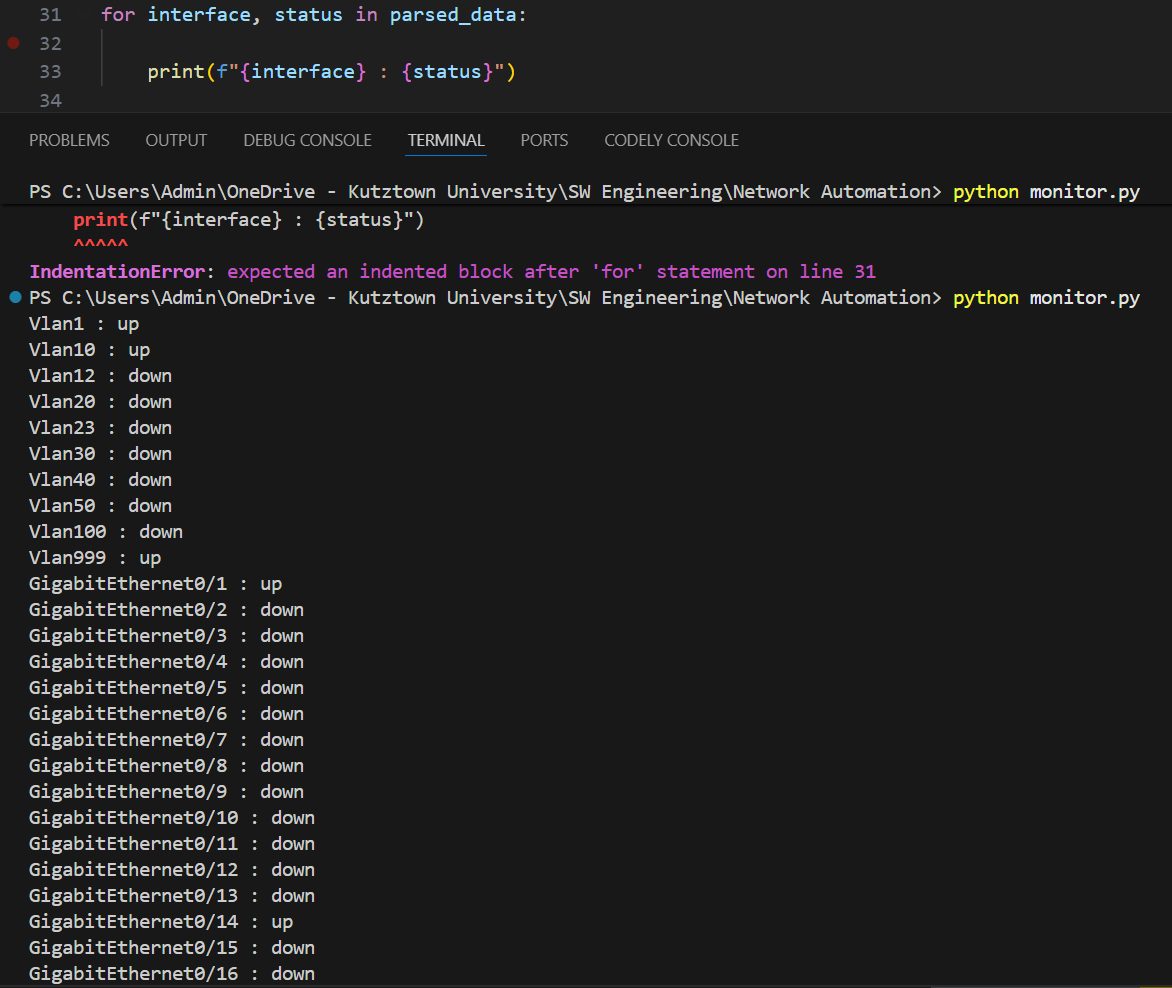
show interfaces statusand gets back a table of every interface and whether it’s up or down. - Parses the output and pulls out the interface name and status for each port and VLAN.
- Writes everything to a CSV with a timestamp so you know exactly when the snapshot was taken.
The device type is set to cisco_ios, which tells Netmiko how to handle the session for Cisco IOS specifically.
Here’s what the connection block looks like:
device = {
    "device_type": "cisco_ios",
    "host": "192.168.12.99",
    "username": "admin",
    "password": "yourpassword",
}
Once connected, send_command() runs the show command and returns the output as a string, which then gets parsed and saved.
Running the show command and storing the output for parsing.
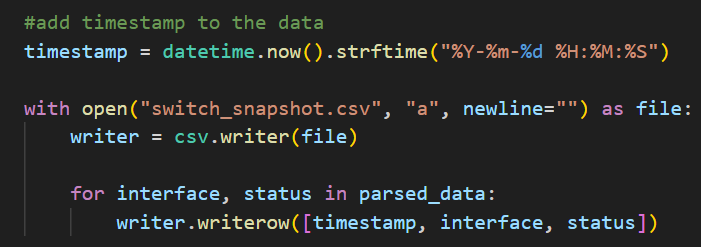 Adding a timestamp to each row.
Running the Script
Run it from the command line:
python switch_monitor.py
It connects, grabs the data, and exits. Takes a few seconds.
 Script running successfully in the terminal.
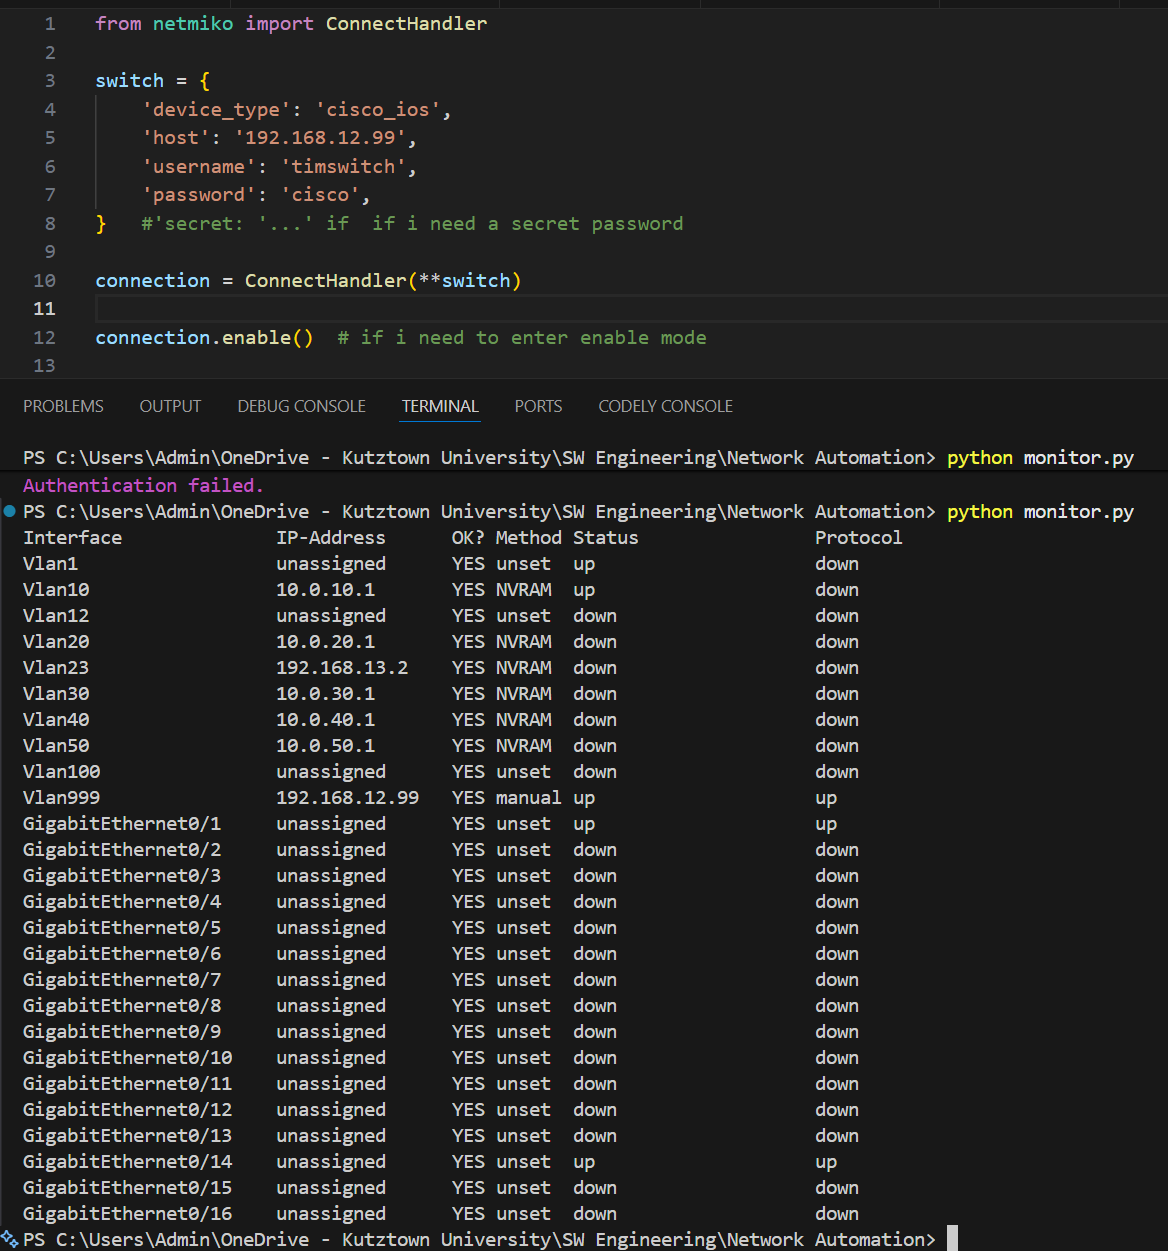
The Output
The script prints a human-readable summary in the terminal and also saves a CSV to disk.
Human-readable output:
 Human-readable output printed to the terminal.
Computer-readable output:
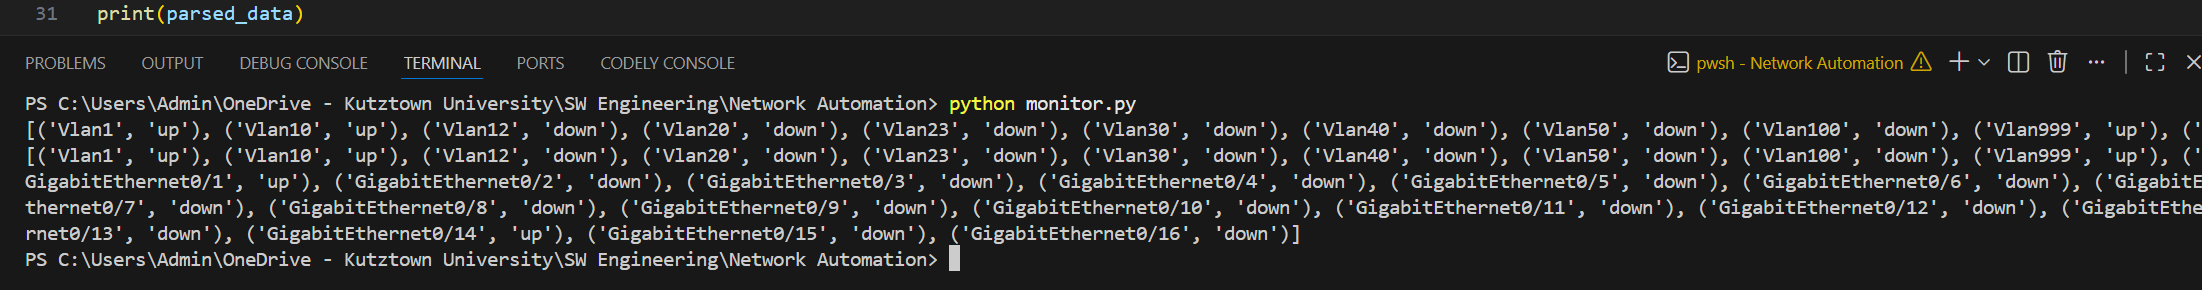 Computer-readable output, the raw parsed data as a Python list.
The CSV
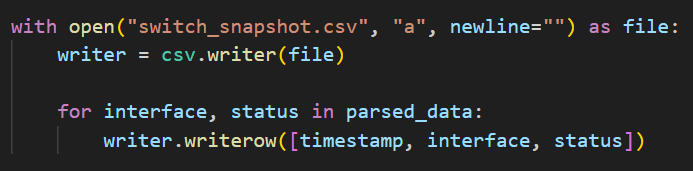 Writing each row to a .csv file.
The CSV has three columns: timestamp, interface, and status. From this snapshot:
- Vlan1, Vlan10, Vlan999 are up: these are my active VLANs (management and data)
- GigabitEthernet0/1 is up: port connected to my PC
- GigabitEthernet0/14 is up: port connected to another lab device
- Everything else is down, which is expected
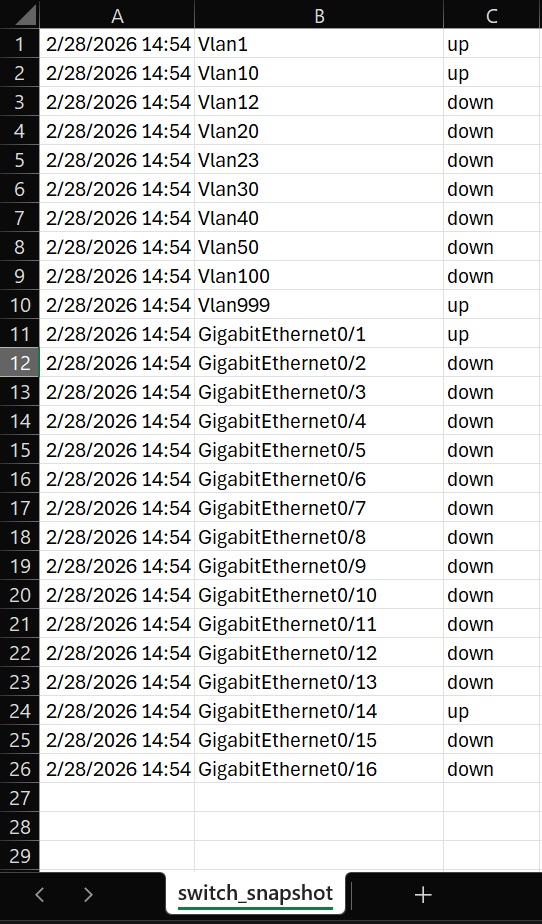 CSV file opened showing all interface snapshots.
Conclusion
Before this, checking interface statuses meant SSHing into the switch manually and running commands every time. Now the script handles it and logs the output automatically.
It also gave me a better understanding of how tools like Ansible work under the hood since they’re basically doing the same thing at a larger scale. This was my first time writing code that talks directly to physical network hardware, which was pretty cool to see work.